· Blog · 127 min read
MONTH 24 STUDY RESULTS
Screening and Enrollment Flow Analysis Flow Reporting Tables Table 1. Expected and Actual Enrollment by month during the enrollment period Month,...
Screening and Enrollment Flow
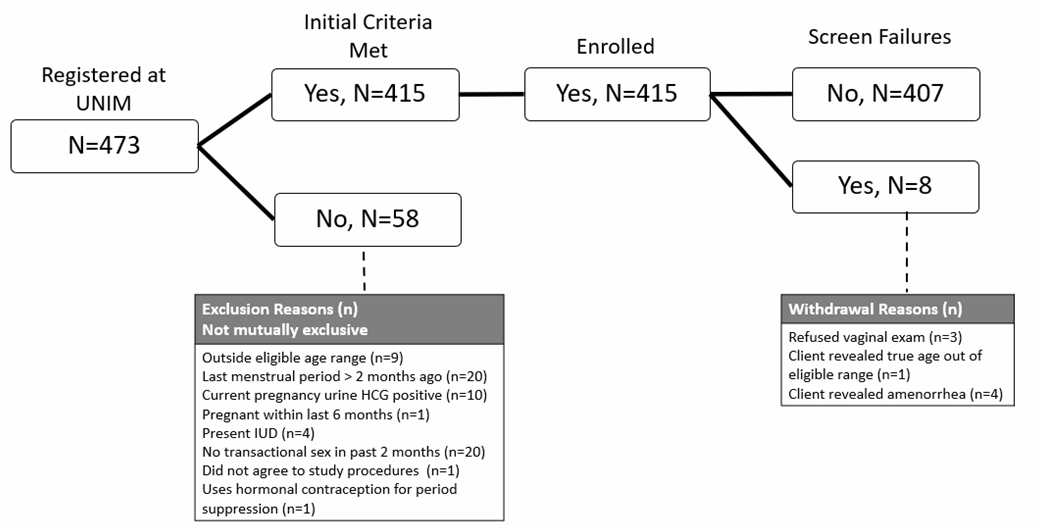
Analysis Flow
Reporting Tables
Table 1. Expected and Actual Enrollment by month during the enrollment period
|
Month, Dates |
Expected
Enrollment, N (%) |
Actual,
N (%) |
|
Month 1, Feb 9 - 28 |
67 |
41 |
|
Month 2, March 1 – 27 |
67 |
51 |
|
Month 3, April 3 - 28 |
67 |
18 |
|
Month 4, May 10-31 |
67 |
51 |
|
Month 5, June 1-30 |
67 |
50 |
|
Month 6, July 1-31 |
67 |
52 |
|
Month 7, Aug 1-30 |
- |
84 |
|
Month 8, Sept 1-30 |
- |
60 |
|
Total |
402 |
407 |
Table 2. Completed Study Forms
|
Database Forms |
Number
Completed |
||||
|
|
Baseline |
6 Months |
12Months |
18Months |
24Months |
|
Screening
& Eligibility |
473 |
X |
X |
X |
X |
|
Locator Form1 |
407 |
X |
X |
X |
X |
|
Behavioral
Survey |
407 |
332 |
332 |
331 |
343 |
|
Medical Exam Form |
407 |
332 |
332 |
331 |
343 |
|
Clinical
Diagnosis & Treatment Form |
407 |
3 |
332 |
6 |
343 |
|
Lab Requisition & Results |
407 |
326 |
332 |
331 |
343 |
|
HIV
C&T Form |
407 |
0 |
332 |
0 |
343 |
|
Withdrawal Form (prior to the stated
visit) |
|
11 |
6 |
6* |
11 |
|
Etiological
Diagnosis and Treatment Form |
147 |
95 |
167 |
115 |
164 |
|
WASH Assessment |
47 |
0 |
0 |
0 |
49 |
|
Total |
|
|
|
|
|
1 Contact information is confirmed and updated as needed at each study visit. *1 withdrew post 12M and prior to intervention.
Table 3. Expected and Actual Study Visits by Time Point
|
Database Forms |
Expected |
Actual |
|
Initial Screen |
503 |
473 |
|
Baseline Enrollment |
402 |
407 |
|
6 Month Follow-Up (August 2023) |
41 |
52 |
|
6 Month Follow –Up (September) |
51 |
41 |
|
6 Month Follow – Up (October) |
18 |
32 |
|
6 Month Follow - Up (November) |
51 |
25 |
|
6 Month Follow – Up (December) |
50 |
14 |
|
6 Month Follow – Up (January 2024) |
52 |
66 |
|
6 Month Follow – Up (February 2024) |
84 |
40 |
|
6 Month Follow – Up (March 2024) |
60 |
54 |
|
6 Month Follow – Up (April 2024) |
14 |
8 |
|
12 Month Follow Up (January 2024) |
13 |
|
|
12 Month Follow UP (February 2024) |
52 |
51 |
|
12 Month Follow Up (March 2024) |
41 |
27 |
|
12 Month Follow Up (April 2024) |
32 |
36 |
|
12 Month Follow Up (May 2024) |
25 |
26 |
|
12 Month Follow Up (June 2024) |
14 |
21 |
|
12 Month Follow Up (July 2024) |
66 |
37 |
|
12 Month Follow Up (August 2024) |
40 |
56 |
|
12 Month Follow Up (September 2024) |
54 |
57 |
|
12 Month Follow Up (October 2024) |
8 |
4 |
|
12 Month Follow Up (November 2024) |
1 |
|
|
Intervention |
306 |
|
|
18 Month Follow Up (July) |
14 |
11 |
|
18 Month Follow Up (August) |
51 |
43 |
|
18 Month Follow up (September) |
27 |
44 |
|
18 Month Follow Up (October) |
36 |
9 |
|
18 Month Follow Up (November) |
26 |
40 |
|
18 Month Follow Up (December) |
21 |
13 |
|
18 Month Follow Up (January 2025) |
41 |
38 |
|
18 Month Follow Up (February 2025) |
67 |
55 |
|
18 Month Follow Up (March 2025) |
64 |
66 |
|
18 Month Follow Up (April 2025) |
16 |
12 |
|
18 Month Follow Up (May 2025) |
2 |
0 |
|
18 Month Follow Up (June 2025) |
1 |
0 |
|
24 Month Follow-Up |
322* |
|
|
24 Month Follow Up (January 2025) |
12 |
24 |
|
24 Month Follow Up (February 2025) |
41 |
46 |
|
24 Month Follow Up (March 2025) |
3 |
45 |
|
24 Month Follow Up (April 2025) |
3 |
8 |
|
24 Month Follow Up (May 2025) |
5 |
44 |
|
24 Month Follow Up (June 2025) |
129 |
81 |
|
24 Month Follow Up (July 2025) |
85 |
76 |
|
24 Month Follow Up (August 2025) |
31 |
19 |
|
24 Month Follow Up (September 2025) |
26 |
|
|
24 Month Follow Up (October 2025) |
|
|
|
24 Month Follow Up (November 2025) |
|
|
*Estimate 80% Completion at End line in sample size calculation
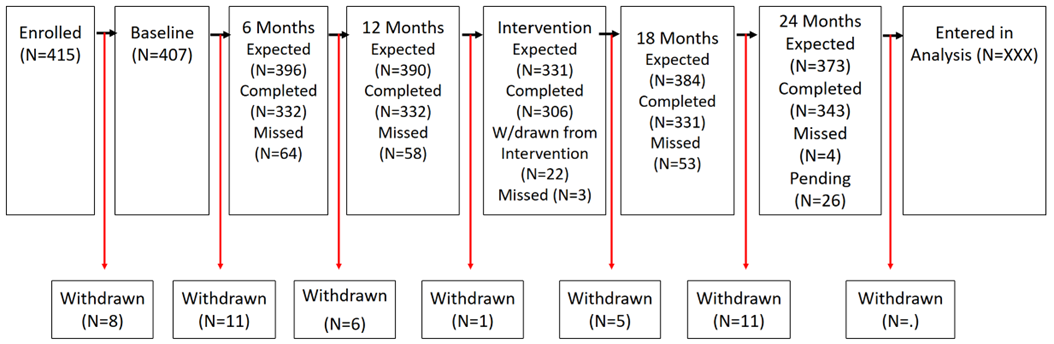
Table 4. Number of early withdrawals from the trial
|
Total
Early Withdrawal |
Withdrawn
from Study N
(%) |
Withdrawn
from Intervention but continuing in study |
|
Screen
failure: After consent, ineligible (gave incorrect birthdate (n=1), disclosed
amenorrhea (n=4), declined pelvic exam (n=2), died (n=1)) |
8 |
|
|
After
Baseline, before 6 months (no longer interested (n=2), relocated (n=8),
incarcerated (n=1)) |
11 |
|
|
After
6 Month Follow-Up, before 12 months (no longer interested (n=4),
relocated (n=2)) |
6 |
|
|
After
12 Month Follow-Up, before Intervention (co-enrolled in another study (n=1)) |
1 |
|
|
Completed
12 Month Follow-Up, and withdrawn by investigators from Intervention1 |
|
22 |
|
After
Completion of Intervention and before 18 Month Follow-Up (co-enrolled
in another study (n=1), inserted an IUD (n=2), no longer interested
(n=1), relocated (n=1) |
5 |
|
|
After
18 Month Follow-Up and before 24 Month Follow-Up -no longer interested (n=8),
relocated (n=1), died (n=1), Had an Hysterectomy (n=1) |
11 |
|
1 Reasons withdrawn from intervention: Taking part in PrEP cervical ring study (n=2); currently pregnant (n=14); recently delivered (6)
Table 5. Number and Type of protocol deviations
|
Protocol Deviations |
N |
|
Issues with enrollment: |
0 |
|
Outside of Age Range |
0 |
|
Other exclusion/inclusion criterion
error |
0 |
|
Intervention
Delayed > 4 weeks1 |
6 reported to IRB |
|
Other: |
|
|
Extra specimens/tests taken |
0 |
|
Wrong appointment date2 Late
for 12M visit due to traveling, n=3: 27 days late, 14 days late, 20 days late Late
for 18M visit due to traveling, n=4: 4d late, 10d late, 2d late, 9d late Early for 12M visit, n=4: 5d early b/c
traveling to TZ and would miss visit Early for M24 [GZ1] [GZ2] Visit n=1: 15 days early n=1, Late
for M24 Visit n=2: Late for 2 days, n=1: Late for 12 days, n=1 |
13 reported to IRB |
|
Serious adverse event not reported within 48 hours |
0 |
|
ID assigned to two clients but
corrected |
0 |
|
Appropriate form(s) not completed |
0 |
|
Appropriate specimens/tests not taken |
2 not reported |
|
Sample results delayed |
0 |
|
Impersonator took visit |
0 |
|
Wrong treatment given for BV |
85 – reported all to IRBs, NIH, and
DSMB |
|
Total |
106 |
1 One participant received intervention 16 days late, 1 received 26 days late (could not get time off from work); one was 7 days late due to traveling for a funeral; one was 26 days late due to waiting for 6-moth post-partum period to complete; 1 was 2 days late due to a funeral; 1 was 1 day late due to phone got lost.
2 Six participants were prior to their 12 month visit date opening: 1 was to travel to Tanzania and would have missed her visit otherwise; 5 were seen early due to synchronization issue with tracker.
5 participants were seen late (2 M12, 3 M18); 4 due to travel, 1 due to lost phone. 1 Participant was seen early for M24, was travelling to West Pokot, 1 Participant was seen late due to being away from Kisumu.
The minor deviations are being batched for report to IRB.
Table 6. Baseline Characteristics
|
Baseline Characteristics |
N
(%) |
|
Age in years (median, IQR) |
27.3
(23.7-31.1) |
|
Ethnic
Group: |
|
|
Luo |
365
(89.7) |
|
Other |
42
(10.3) |
|
Education Level: |
|
|
< Secondary school |
241
(59.2) |
|
Secondary school or more |
166
(40.8) |
|
Employment |
|
|
Sex work only |
238
(58.5) |
|
Sex work + other |
169
(41.5) |
|
Has non-paying male partner (husband,
boyfriend, etc.) |
283
(69.5) |
Table 7. Baseline Vaginal Microbiome, STI and HIV, and Signs and Symptoms of Infection
|
Baseline Physical Characteristics |
N
(%) |
|
Laboratory
Results |
|
|
Herpes
Simplex Virus Type 2 seropositive (invalid,
n=3; missing n=1) |
253
(62.8) |
|
Composite STI |
90
(22.1) |
|
Trichomonas vaginalis (missing, n=2) |
30
(7.4) |
|
Neisseria gonorrhoeae
(missing, n=1) |
22
(5.4) |
|
Chlamydia trachomatis (missing, n=1) |
53
(13.0) |
|
Bacterial vaginosis (missing, n=2) |
171
(42.0) |
|
HIV
(missing, n=1) |
100 (24.6) |
|
Community State Type (CST) (missing,
n=1)
CST-I (L. crispatus dominated)
CST-II (L. gasseri dominated)
CST-III (L. iners dominated)
CST-IV (G. vaginalis dominated; mixed)
CST-V (L. jensenii dominated) |
31
(7.6) 1
(0.2) 118
(29.1) 255
(62.8) 1
(0.2) |
|
Physical Exam Results |
|
|
Vaginal or cervical discharge |
55
(13.5) |
|
Genital
ulcers or vesicles |
3
(0.9) |
|
Cervical motion tenderness or
friability |
3
(0.9) |
|
Adnexal
tenderness or mass |
3
(0.9) |
|
Cervical abnormalities: laceration,
excoriation, edema, erosion, abrasion, ecchymosis, tear, fissure |
1
(0.3) |
Table 8. Baseline Confounders
|
Baseline Confounders |
N
(%) |
|
HSV-2 Serostatus |
253
(62.8) |
|
HIV
Status |
100
(24.6) |
|
Employment
Sex work only
Sex work plus other work (less economically dependent) |
238
(58.5) 169
(41.5) |
|
Baseline
method of menstrual management Disposable pads Reusable Pads Cloth Cotton Wool/Balls Tissues Tampons |
378
(92.9) 21
(5.2) 32
(7.9) 139
(34.2) 56
(13.8) 9
(2.2) |
|
Sex work during menses
Stays same
Reduces
Increases |
173
(42.5) 232
(57.0) 2
(0.5) |
Table 9. Adverse events
|
Measure |
N
(%) |
|||||||
|
|
BL N=407 |
6M N=332 |
12M N=332 |
13M1,2, 3 N=284 |
14M1,2, 3 N=274 |
15M1,2, 3 N=284 |
18M N=331 |
24M N=343 |
|
Abuse
and Violence |
|
|
|
|
|
|
|
|
|
Any Physical abuse (composite of 6 questions) |
59
(14.5) |
20 (6.1) |
44 (13.6) |
NA |
NA |
NA |
36 (10.9) |
33 (9.6) |
|
Any
Sexual abuse (composite
of 4 questions) |
23
(5.6) |
6 (1.8) |
11 (3.3) |
NA |
NA |
NA |
10 (3.0) |
14 (4.1) |
|
Raped or forced sex |
4
(1.0) |
0
(0.0) |
0
(0.0) |
NA |
NA |
NA |
0
(0.0) |
2
(0.6) |
|
Any
Emotional or financial abuse
(composite of 2 qs) |
190
(46.6) |
78 (23.6) |
143 (43.1) |
NA |
NA |
NA |
103 (31.1) |
111 (32.4) |
|
Cervicovaginal
injuries4 |
|
|
|
|
|
|
|
|
|
Vaginal laceration |
0
(0.0) |
0 (0.0) |
0
(0.0) |
|
|
|
0
(0.0) |
0 (0.0) |
|
Cervical laceration |
1
(0.0) |
0
(0.0) |
0
(0.0) |
|
|
|
0
(0.0) |
0
(0.0) |
|
Menstrual
toxic shock syndrome |
0
(0.0) |
0 (0.0) |
0
(0.0) |
|
|
|
0
(0.0) |
0 (0.0) |
|
Client was angry you were having your
menses |
52 (12.8) |
24 (7.2) |
29 (8.7) |
|
|
|
1 (0.3) |
0 (0.0) |
|
Client
reaction to menses |
|
|
|
|
|
|
|
|
|
Refused to pay, paid |
25 (6.1) |
10 (3.0) |
10 (3.0) |
|
|
|
0 (0.0) |
0 (0.0) |
|
Verbal assault |
23 (5.6) |
10 (3.0) |
10 (3.0) |
|
|
|
1 (0.3) |
0 (0.0) |
|
Physical assault |
2
(0.6) |
0
(0.0) |
0
(0.0) |
|
|
|
0
(0.0) |
0
(0.0) |
|
Cup related |
|
|
|
|
|
|
|
|
|
Had
menses since |
|
|
|
236 (83.1) |
264
(96.4) |
281
(98.9) |
|
|
|
Received
cup |
|
|
|
|
|
|
279
(84.3) |
285 (83.1) |
|
Still
have cup |
|
|
|
|
|
|
270 (96.8) |
264 (92.6) |
|
Used
cup |
|
|
|
222 (94.1) |
258 (97.7) |
274 (97.5) |
259 (92.8) |
272 (95.4) |
|
Cup retention |
NA |
NA |
NA |
6
(2.7) |
1
(0.5) |
0
(0.0) |
0
(0.0) |
1
(0.4) |
|
Pain during / after cup use |
NA |
NA |
NA |
16 (7.2) |
3 (1.5) |
2 (0.9) |
1 (0.4) |
0 (0.0) |
|
Partner violence due to cup use
(refused to pay, paid less
than agreed, verbal assault, physical assault) |
NA |
NA |
NA |
0
(0.0) |
0
(0.0) |
0
(0.0) |
0
(0.0) |
0
(0.0) |
1Full IPV and abuse scales are not implemented at the 13-, 14-, and 15- month phone calls post intervention.
2Participants reporting pain with menstrual cup use are asked to return for retraining and examination if needed.
3Denominators for cup-related concerns are restricted to those who report having used their cup in that time period.
4Genital examination with bimanual and speculum exam is planned at baseline, 12-, and 24- month visits, and is conducted at 6- and 18- month visits for participants reporting vaginal symptoms, or requesting examination.
Table 10. Outcomes (every 6 months)
|
Outcome |
N
(%) |
|
Primary: BV cumulative prevalence*
Control period
Baseline prevalence
6 months prevalence Proportion with prior BV
12 months prevalence Proportion with prior BV (BL or 6M)
Intervention period
18 months prevalence Proportion with prior BV (BL, 6M, or
12M)
24 months prevalence Proportion with prior BV (BL, 6M,
12M, 18M) |
171
(42.0) 144
(42.9) 71
(49.7) 145
(43.7) 108
(74.5) 135
(40.8) 115
(85.2) 153
(44.5) 122
(80.3) |
|
Secondary:
STI Composite cumulative incidence* Control period Baseline prevalence Prevalence at 12 months Incidence at 12 months Intervention period Prevalence at 24 months Incidence at 24 months |
90
(22.1) 78
(23.4) 71 (21.3) 68
(19.9) 61
(17.9) |
|
Trichomonas vaginalis
Control period
Baseline prevalence
Prevalence at 12 months
Incidence at 12 months
Intervention period
Prevalence at 24 months
Incidence at 24 months |
30
(7.4) 25
(7.5) 25
(7.5) 24
(7.0) 19
(5.6) |
|
Neisseria gonorrhoeae Control period Baseline prevalence Prevalence at 12 months Incidence at 12 months Intervention period Prevalence at 24 months Incidence at 24 months |
22
(5.4) 17
(5.1) 15
(4.5) 17
(5.0) 14
(4.1) |
|
Chlamydia trachomatis
Control period Baseline
prevalence Prevalence at
12 months Incidence at 12 months
Intervention period Prevalence at 24 months Incidence at 24 months |
53
(12.8) 45
(13.6) 40
(12.0) 37
(10.9) 35
(10.3) |
|
Secondary:
CST-I (vs. non-optimal vaginal microbiome) Control period Baseline 6 Months 12 Months Intervention period 18 Months 24 Months |
31
(7.6) 16
(4.8) |
|
Mean Relative abundance (SD) L.
crispatus
Control period
Baseline
6 Months
12 Months
Intervention period
18 Months
24 Months |
7.2
(23.7) 4.8
(18.7) |
*Infections following previously treated infections are included; for infections in which prior treatment is not documented, they are not included as incident infection.
Table 11. Other Outcomes (monthly)
|
Unsafe menstrual management practices |
N
(%) |
|||||
|
|
BL |
6M |
12M |
18M |
24M |
|
|
The
last time you had sex: did you insert objects inside vagina for sex during
menses (e.g., Kusunda, cotton wool, tissue, sponge, mattress stuffing, foam)
[q65_b1] |
23
(5.6) |
14 (4.3) |
17
(5.1) |
2 (0.6) |
1
(0.3) |
|
|
In the past 6 months: Used drying or
tightening agents inside vagina for sex during menses (e.g., vinegar, soap,
ice, etc.)
Never
Sometimes
Often
Always
Declined |
261
(64.0) 51
(12.5) 12
(2.9) 71
(18.6) 8
(2.0) |
275
(82.6) 25 (7.5) 18
(5.4) 15
(4.5) 0
(0.0) |
292
(88.0) 17
(5.1) 8
(2.4) 15
(4.5) 0
(0.0) |
322
(97.3) 4
(1.2) 3
(0.9) 2
(0.6) 0
(0.0) |
339
(98.8) 4
(1.2) 0
(0.0) 0
(0.0) 0
(0.0) |
|
|
How
often do you use a cloth, tissue, paper, or cotton to wipe inside your
vagina? [q82] Never Sometimes Often Always Declined |
29
(7.1) 10
(2.5) 55
(13.5) 313
(76.9) 0
(0.0) |
131 (39.5) 21 (6.3) 42 (12.7) 138 (41.6) 0 (0.0) |
28
(8.4) 21
(6.3) 57
(17.2) 226
(68.1) 0
(0.0) |
162 (48.9) 13 (3.9) 41 (12.4) 115 (34.7) 0 (0.0) |
163
(47.5) 31
(9.0) 38
(11.1) 111
(32.4) 0
(0.0) |
|
Table 12. Post-Trial Cup Distribution
|
N
(%) |
|
|
Did not receive cup at M12 and
completed M24 visit
Contacted
Not Eligible to receive cup (pregnant,
recently delivered, IUD)
Eligible to receive cup
Scheduled to come for
post-trial cup intervention Attended Did not attend Received cup previously but it was lost
or stolen/taken and is being replaced
Scheduled to come for post-trial cup distribution
Attended
Did not attend |
82 0 82
82 60
22 22 22 18
4 |
|
For
participants receiving cup for first time after the M24 visit 1-Month
phone survey Completed Not completed |
|
|
For
those without prior cup |
|
|
Used cup |
|
|
Cup retention |
|
|
Pain during / after cup use |
|
|
Partner violence due to cup use (refused to
pay, paid less than agreed, verbal
|
|